
Whenever you want to know what happened with your updates, you can check the logs. The support & consultancy team is happy to help you with this, but it might be easier and faster to check the logs yourself.
In the left-hand menu, you can find the button ‘’Logs’’. When you click on this, you find a similar overview to the screenshot below:

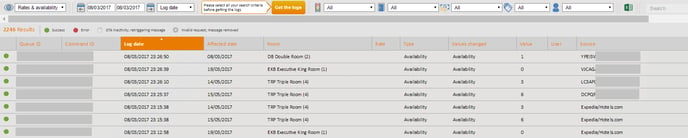
Because of the number of messages available in the log screen we recommend you use the filter options.
- Type of Log
- General Logs are configuration changes made by a user
- Rates and Availability Logs are described as above
2. Search Dates
- Select your date range for the messages
3. Date Type
- Log date is when the message was created
- The affected date is when the particular update was for
4. Refresh Status
- Filter the message to show All messages or by Waiting, Queued, Success, Error, Retriggering message or Message removed
5. Room Type
6. Rate Code
7. Value Type
- Choose whether you are searching for and Availability, Rates or Restrictions message
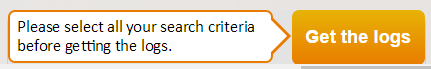
Once you have applied all of your search criteria, you can then get the logs. You can do this by clicking on the orange button on top of the page.

Example 1: how to check availability changes
Select the affected date, the room and choose the value code ‘’Availability’’. You will then see your message with the below information:

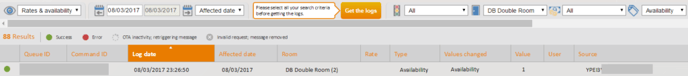
- The Log Date column shows the date and time that the message was created in the SmartHOTEL Extranet, and the Affected Date column indicates the date that the message is updating.
- The Room column shows the Room Type that is updated. The Type shows it is an Availability update, and the Value indicates the number of rooms that are now available.
- The Source is the echo token from your PMS that relates to the message produced in that system. This is useful when troubleshooting between systems. Should manual changes have been made, the Source will show the username.
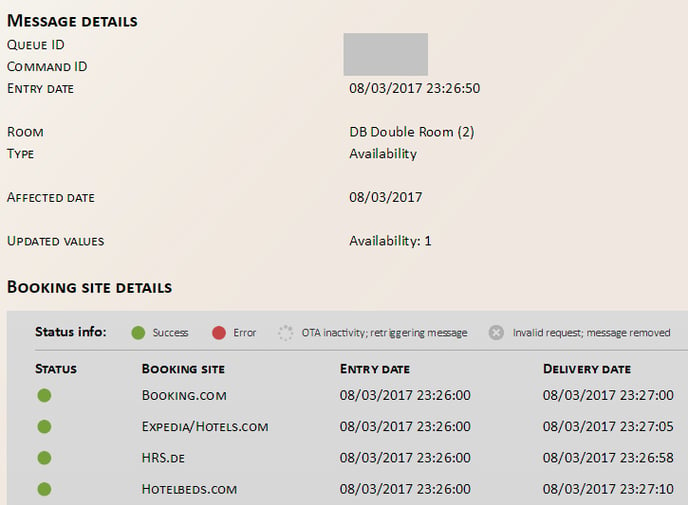
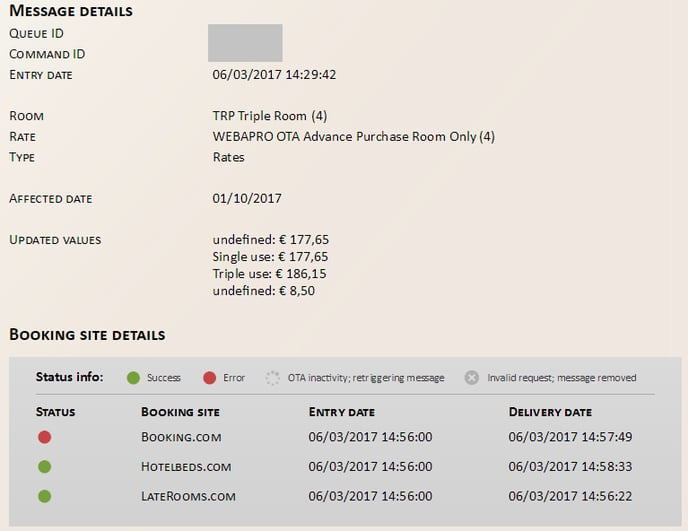
If you click on the message it will open in a new screen displaying the OTAs that this message was sent to:

Example 2: how to check rate changes
Select the affected date, the room and choose the value code ‘’Rates’’. You will then see your message with the below information:

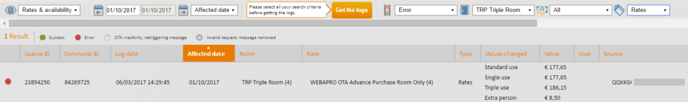
The difference here is the Rate Column showing the rate that is changing, the Values Changed, showing the occupancy settings, and Value is the actual rates sent to the OTA.
This example also shows that there was an error, as indicated by the red dot. If you click on the message you can see which OTA the message failed to update:

Example 3: how to check restriction changes
Select the affected date, the room and choose the value code ‘’Restrictions’’. You will then see your message with the below information:

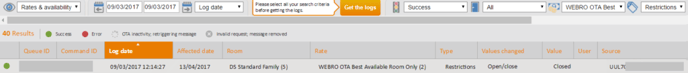
The above example is for a Restriction change, and you can see the Restriction type in the Value column, along with the room type/rate code that was updated.
The message has status ‘’error’’, why is that?
There are several reasons why a message may fail upon the first attempt to send it. Common reasons could be that the OTA was experiencing a high level of traffic and did not process the message quickly enough or it could be that the OTA rejected the update.
For example, you may be trying to update a rate to higher or lower than the OTAs rate threshold or if you are sending a close restriction but the OTA has contracted rooms that they have not yet sold.
The system automatically resends messages with common timeout errors and your support team try to resend all other failed messages. You will be advised via email of messages that were rejected by the OTA.